 ECG filters can have a substantial effect on the test results in IEC 60601-2-25, IEC 60601-2-27 and IEC 60601-2-47. In some clauses the standard indicates which filter(s) to use, but in most cases, the filter setting is not specified. One option is to test all filters, but this can be time consuming. Also, it is not unusual to find that some tests fail with specific filter settings. This section is intended to give some background on the filters and the effect of filters, so test engineers can decide which filter settings are appropriate.
Most test engineers covered filters at some point in their education, but that knowledge may have become rusty over time, so the following includes some information to brush up on filter theory while heading into the specifics of ECG filters.
Section 1: The technology behind filters
What is a filter?
In general, filters try to remove unwanted noise. Especially in ECG work, the signal levels are very small (around 1mV), so it is necessary to use filtering to remove a wide range of noise. This noise may come from an unstable dc offset from electrode/body interface, muscle noise, mains hum (50/60Hz), electrical noise from equipment in the environment and from within the ECG equipment itself, such as from internal dc/dc converters.
 A filter works by removing or reducing frequencies where noise occurs, while allowing the signal frequency through. This can be done in either hardware or software. In modern systems, the main purpose of hardware filtering is to avoid exceeding the limits of the analogue system, such as opamp saturation and ADC ranges. Normally a 1mV signal would be amplified around 100-1000 times prior to ADC sampling, if this signal had even 10mV of noise prior to amplification, we can expect amplifiers to saturate. The main limitation of hardware filters is that they rely on capacitors, the value of which cannot be controlled well both in production and in normal use. Thus software filtering is usually relied on for filter cut-off points that can be controlled accurately, allowing also advanced filter models and user selected filters to be implemented.
What are typical types of ECG filtering? Why are there different filters?
Ideally, a filter should remove noise without affecting the signal we are interested in. Unfortunately, this is rarely possible. One reason is that the signal and noise may share the same frequencies. Mains noise (50/60Hz), muscle noise and drift in dc offsets due to patient movement all fall in the same frequency range as a typical ECG. Another problem is that practical filters normally don't have a sharp edge between the "pass" band and the "cut" band. Rather there is usually a slow transition in the filters response, so if the wanted and unwanted signals are close we may not be able to remove the noise without removing some of the desired signal.
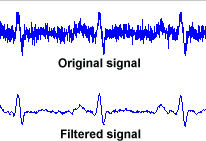
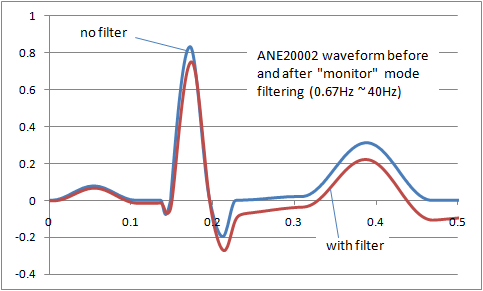 The result is that filters inevitably distort the signal frequency. The image right shows the distortion of the ANE20002 waveform from IEC 60601-2-25 with a typical "monitor" filter from 0.67Hz to 40Hz. A balance has to be found between removing noise and preserving the original signal. For different purposes (monitoring, intensive care, diagnostic, ambulatory, ST segment monitoring etc) the balance shifts, so we end up with a range of filters adjusted to get the best balance. Some common examples of ECG filters are:
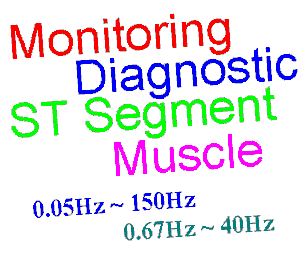
Diagnostic: 0.05Hz ~ 150Hz
Widest for diagnostic information, assumes a motionless, low noise environment
Ambulatory, patient monitoring: 0.67Hz ~ 40Hz
Mild filtering for noisy environment, principally to detect the heart rate
ST segment: 0.05Hz ~
Special extended low frequency response for ST segment monitoring (more detail below)
Muscle, ESU noise: ~ 15Hz
Reduced higher frequency response to eliminate muscle noise and other interference such as ESUs
While ECGs could be referred to as using a band pass filter, the upper and lower frequencies of the pass band are sufficiently apart that we can discuss them seperately as low pass and high pass filters.
 What is a low pass filter? What distortion is caused by low pass filtering?
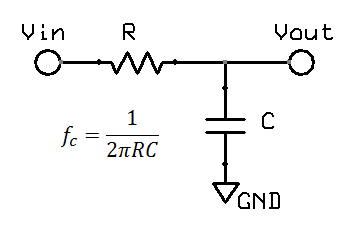
A low pass filter is often found in electronic circuits, and works by reducing high frequency components. The most common form of a hardware low pass filter is a simple series resistor / capacitor: at low frequencies the capacitor is high impedance relative to the resistor, but as the frequency increases the capacitor impedance drops and output falls. A circuit with only one resistor/capacitor is a "single pole filter". Due to origins in audio work and similar fields, filters are normally specified by the frequency at which there is a "3dB reduction", or where the output voltage is around 71% (0.707) of the input. While this may sound large, in the audio field the dynamic range is so large that a log scales are required, and on this scale 3dB reduction (30%) is not so big. For a large dynamic range, units of decibels (dB) are more convenient. Decibels originated in power, using simple scale of 10 log10(Pout / Pin). In electronics, measurement of voltage is more common, thus we end up with 20 log10(Vout / Vin). The factor of 20 rather than 10 reflects the square relationship between voltage and power, which in the log world is an additional factor of 2.
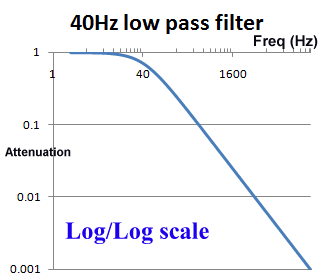
 The use of log scales can be misleading. Graphically in the log/log scale, the output of a single pole filter is basically 1:1 (100%) in the "pass band", and then drops of steeply as the frequency increases, quickly reaching levels of 1% (0.01) and lower.
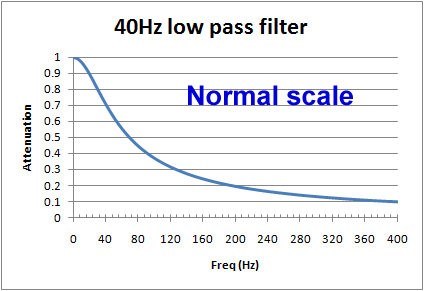
However, if we look at a graph using a normal scale (non-log), we see that around the frequency of interest, the cut of is actually pretty slow. For example, for a 40Hz filter, at 20Hz there will still be more than 10% reduction, and at 100Hz, still 37% of the signal is getting through. When testing an ECG's filter response and other characteristics, is it common to see effects due to filters above and below the cut off frequencies.
In software, filters can be used which closely approximate hardware filters, but other complex forms are possible. Sharper cut off between the pass band and cut band can also be achieved. Great care is needed with software filters as unexpected results can easily occur due to the interplay between sampling rates and the chosen methodology.
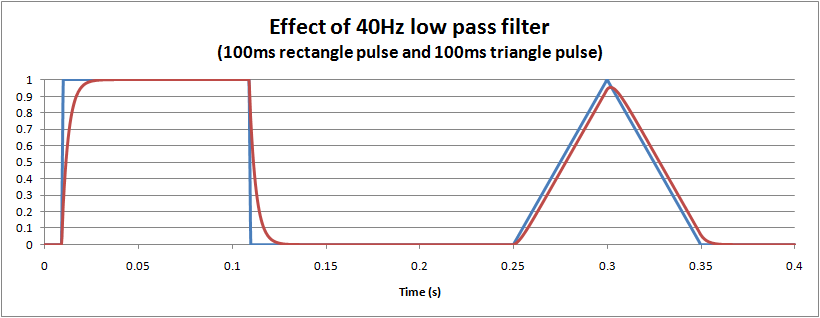
The distortion caused by a hardware (or equivalent software) single pole low pass filter is easy to visualise: it essentially dampens and slows the waveform, much like suspension in a car. The following graph shows the effect of a 40Hz monitoring filter on 100ms rectangle and triangle pulses. For the triangle it is interesting to note that there is about a 5% reduction in the peak measured, and also a small delay of around 3ms.
What is a high pass filter? What are the effects?
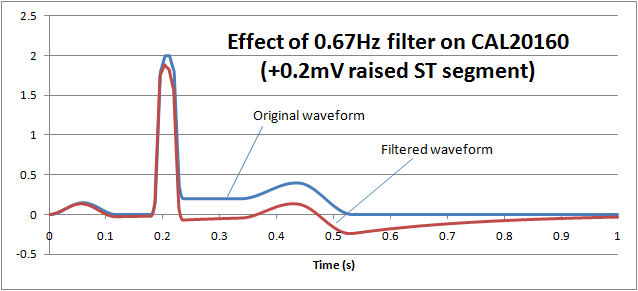
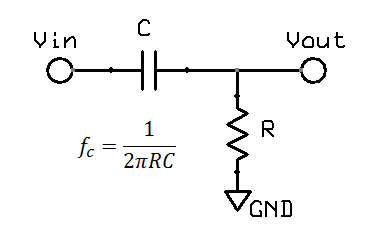 High pass filters are obviously the opposite of a low pass filters. In hardware, a single pole filter can be made out of a capacitor in series with a resistor. The corner frequency is the same, and the frequency response is a mirror image (vertical flip) of the low pass filter.
The terminology associated with ECG high pass filters can be confusing: while the filter is correctly termed a "high pass filter", it affects the low frequency response, around the 0.05Hz to 1Hz region. So it is easy to get mixed up between "high" and "low".
The main intention of a high pass filter in ECG work is to remove the dc offset which in turn is largely caused by the electrode/gel/body interface. Unstable voltages of up to 300mVdc can be produced. In diagnostic work, the patient can be asked to stay still so as to reduce these effects, allowing the filter corner to be reduced down to 0.05Hz. For monitoring and ambulatory use, a 0.67Hz corner is common.
For long term periodic waveforms the main effect is to shift or keep the waveform around the centerline, known as the "baseline" in ECG. This is the same as using the AC mode on an oscilloscope to view only ac noise of 50mVpp on a 5Vdc supply rail. Most test engineers have little problem to understand this side of high pass filters.
However, for short term pulses, the effects of high pass filters on waveforms are not so easy to visualise. In particular, it is possible to get negative voltages out of a positive pulse waveform, and also peak to peak values exceeding the input. These effects cannot occur with a low pass filter. The hardware filter circuit shown just above, together with the graph below can help to understand why this happens. Initially the capacitor has no charge, so that when a step change (1V) is applied, the full step is transferred to the output. Then the capacitor slowly charges according to the circuit's time constant. For a filter with 0.67Hz, after 100ms, the capcitor is charged to around 0.34V. When the input suddenly drops to 0V, the capacitor remains charged at 0.34V, but the polarity is negative with respect to Vout. The output voltage is Vout = Vin - Vc = 0 - 0.34 = -0.34V. As long as the input remains at 0V, the capcitor then slowly discharges back towards 0V. In this way we can get negative voltages from a positive pulse, a peak to peak voltage of 1.34V (exceeding the input), and finally long slow time constants resulting from short impulses.
This long time constant can cause problems in viewing the ECG trace after large overloads, such as during defibrillator pulses or a temporary disconnected lead. A 0.67Hz high pass filter has a 0.25s time constant, which although is short can still take time since the overloads are in the 1V level, 1000 times higher than normal signals. For these reasons, ECGs are often provided with "baseline reset" or "de-blocking" function to reset the high pass filter. Typically this is an automated function which in hardware filtercan be done by shorting the capacitor (e.g. analogue or FET switch), or in software filters is simply clearing a result back to zero.
Diagnostic filters and other filters that go down to 0.05Hz have a much slower time constant, so it can take 10-15s for the signal to become visible again. Even after an automated baseline reset there may be residual offsets of 5-50mV which keep the signal off the screen. This can be a serious risk if such filters are used in intensive care patient monitoring. Patient monitors are often provided with both diagnostic and monitoring filters, and while they pass defibrillator and 1V 50/60Hz overload tests with the monitoring filter, they fail when tested with a diagnostic filter setting. This is a subject which can cause conflict as the standard does not define which filter to use, and manufacturers often argue that only the monitor filter should be tested. However, basic risk management indicates that regardless of the filter setting, the baseline reset should work effectively. It is fairly obvious that such a filters with 0.05Hz would not be selected for defibrillation, however, it is also unlikely that if the patient monitor was already set to diagnostic mode prior to an emergency situation , we cannot reasonably expect the operator to remember or have the time to mess around changing filter settings. Also, the technology to detect and reset the baseline after overloads is well established.
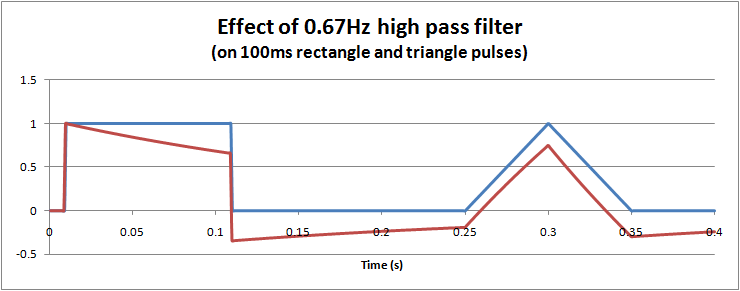
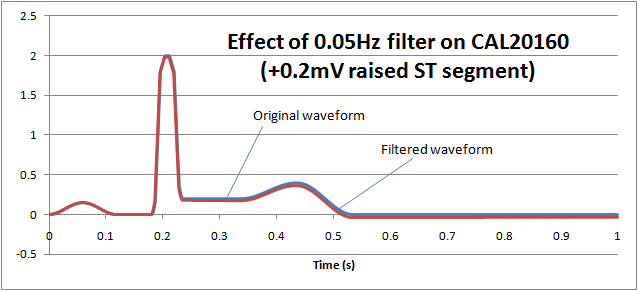
ST filters are also common in patient monitoring and create a similar problem. The purpose of the filter is to preserve the "ST segment" which occurs between the QRS pulse and T wave and can be an important diagnostic indicator. The following graph shows how normal monitoring ECG high pass filter of 0.67Hz on the CAL20160 waveform from IEC 60601-2-25 (+0.2mV elevated ST segment) essentially removes the ST segment:
If we reduce the low frequency response (high pass filter) down to 0.05Hz, we can see that the ST segment remains largely undistorted, allowing diagnostic information to be retained:
Notch filters (mains hum filters, AC filter, 50/60Hz)
Notch filters combine both high and low pass filters to create a small region of frequencies to be removed. For ECGs, the main target is to remove 50Hz or 60Hz noise. Because mains noise falls in the region of interest (especially for diagnostic ECGs), the setting of "AC filter" is usually optional. ECG equipment already contains some ability to reject mains noise even without a filter (see right leg drive) so depending on the amount of AC noise in the environment, an AC filter may not be required. A good check of your ECG testing location is to compare the signals with and without the AC filter on.
Some systems automatically detect the mains frequency, others are set by the user or service personnel, while others use a single notch filter covering both 50/60Hz.
High "quality" notch filters can be created in software that target only 50 or 60Hz, but the drawback of these filters is they can create unusual ringing especially to waveforms with high rates of change. IEC 60601-2-51 has a special waveform (ANE20000) which confirms that the extent of ringing is within reasonable limits.
Similar to the diagnostic filter, the question again arises as to whether patient monitors should pass tests with or without the AC filter. In particular this causes problems with the 40Hz high frequency response requirement, as some systems may fail this response with a 50Hz AC filter on. There is no simple answer for this: 40Hz and 50Hz are very close, so to comply with the 40Hz requirement with a 50Hz notch filter implies advanced multipole filtering. But multipole filters have risks of distortion such as ringing. On the other hand, use of AC filters can be considered "normal condition", so to argue that a test is not required with the AC filter on implies that the 40Hz frequency response is not really important, which would raise the question what upper frequency response is important. ANSI/AAMI (US) standards have an upper limit of 30Hz for patient monitors, which also complicates the situation.
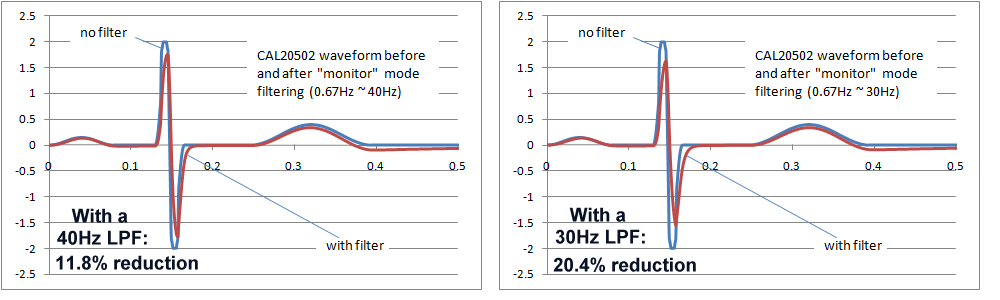
Ultimately, the final decision would require a careful study of the effects of the AC filters on waveforms found in real clinical situations, which also depends in the intended purpose. In particular neonatal waveforms are likely to have higher frequency components, so the high frequency response including AC filters will have the greatest impact only if neonatal patients are included in the intended purpose. The following images show the effects of 40Hz and 30Hz single pole filters on IEC 60601-2-51 waveform CAL20502 (intended to simulate neonatal ECGs). As the images show, the effects are not insignificant. Both filters reduce the peak to peak indication, with the 30Hz filter around 20%, which may be exceeding reasonable limits. However, of course these are single pole filter simulations, which would not relfect the response of more complex filter systems.
Notes on advanced filtering
The simulations above are based on simple single pole filters, which distort the signal in predictable ways and are easy to simulate. Complex multipole and digital filters can have far better responses but there are risks of substantial overshoots and ringing. Experience from testing indicates that manufacturers tend to prefer simple filters, but occasionally use more complex filters where strange results in testing are possible. These results may or may not representative of the real world because the test signals often contain frequencies that don't exist in the real world, such as small digital steps caused by arbitrary waveform generators, or rectangle pulses with excessively fast rise times. This needs to be kept in mind during testing and discussed with the manufacturer.
Section 2: Particular requirements from standards affected by filters
Sensitivity, accuracy of leads, accuracy of screen and printing, similar tests
For tests involving sensitivity (e.g. confirming 10mm/mV within ±5%) and accuracy of lead calculations (such as Lead I = RA - LA), it makes sense to use diagnostic filter with the AC filter off. The nature of these tests is such that filters should not impact the result, with the effects of filters being handled seperately. The widest frequency response ensures that the waveforms viewed on the screen are essentially the same as the input waveforms, avoiding some complications due to waveform distortion which are irrelevant to the tests. This assumes that the test environment is sufficiently "quiet" so that mains and other noise does not also influence the result.
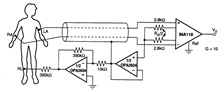
Common Mode Rejection Ratio
As IEC standards point out, the CMRR test should be performed with the AC filter off, if necessary by special software. If avaliable, a patient monitor should be tested using the widest (diagnostic) filter mode, which is worst case compared to monitor mode. One point to note is that ANSI/AAMI standards (at least, earlier editions) do not require the AC filter to be off, a key difference to the tests in IEC standards.
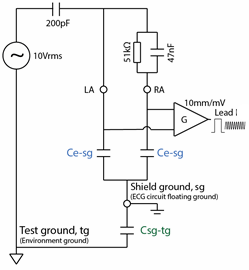
Input impedance test
Due to the high imbalance in one lead (620k/4.7nF), the input impedance test is particularily susceptable to mains noise. Since this is a ratiometric test, the filter setting should not affect the result. If possible, the user should select the mains notch filter to be on, and use the monitoring mode. Other filter settings (like muscle, ESU) might reduce the noise further, but they may also make it difficult to measure at 40Hz as the signal will be substantially attenuated.
Frequency response test
For frequency response tests, including the 200ms/20ms triangle impulse test, obviously all filters should be tested individually. However, there may be discussions as indicated above as to whether compliance is necessary for all settings, which in turn may be based on clinical discusssion. For example, it is obvious that special filters in highly noisy environments (e.g. muscle, ESU) may not meet the 40Hz high frequency response requirment from IEC 60601-2-27. Test labs should simply report the results. For regulatory purposes, manufacturers should discuss the clinical impact where appropraite. For example, a muscle filter with a cut off of 15Hz seems clearly inappropriate for use with neonates.
For IEC 60601-2-27 (0.67Hz to 40Hz), practical tests found that some manufacturers follow the normal practice in frequency response testing of using the input as the reference. For example setting the input to exactly 1mVpp (10mm) and then measuring the output. While this is logical, the standard requires that the output at 5Hz is used as the reference point. In some cases, the 5Hz output can be significantly higher than the input as the result of multipole filters, leading to differences between manufacturer test results in independent laboratory test results.
For IEC 60601-2-25, frequency sweeps up to 500Hz using digital based systems usually finds some point where beating occurs, as a result of the sample rate of the digital function genorator being is a multiple or near multiple of the ECG's sampling rate. For this reason, it is always useful to have a back up analogue style function genorator on hand to verify the frequency response.
Pacemaker indication
Most modern ECGs use a blanking approach to pacemaker pulses: automatic detection of the fast edge of the pacing spike, ignoring the data around the pulse and then replacing the pulse with an artificial indication on the ECG screen or record. If this approach is taken, the filter settings usually do not affect the test results. However, some systems allow the pulse through to the display. In this case, the filter settings can dramatically affect the result. Consult the operation manual prior to the test to see if any special settings are necessary for compliance.
Low frequency impulse response test (3mV 100ms)
The low frequency impulse response test is only intended where the frequency response extends down to 0.05Hz. For patient monitors and ambulatory ECGs, this will typically only apply for special settings such as diagnostic filters or ST-segment analysis. There appears to be an error in IEC 60601-2-47 since it requires the test for all modes, but it is obvious that filters that do not extend down to 0.05Hz cannot pass the test.
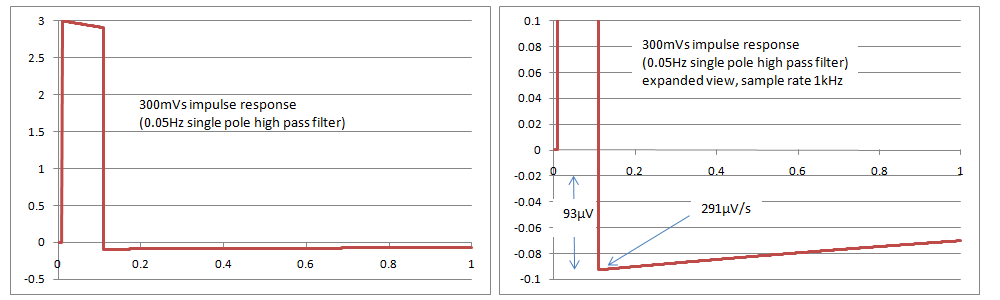
Simulations with a single pole filter 0.05Hz have found that the results just pass the tests in IEC 60601-2-27 and IEC 60601-2-47, with an overshoot of 93uV and a slope of 291uV/s, compared to the limits of 100uV and 300uV/s in the standards. It appears that IEC 60601-2-51 cannot be met with a single pole filter, as it has a slope requirement of 250uV/s. The rationale in the standard indicates that this is intentional. It is very difficult if not impossible to confirm compliance based on inspection of print outs as the values are very small, so it may require digital simulations and assistance from the manufacturer, with the full system test (analogue signal through to the printout) being used only for confirmation. The following graphs show simulated responses for 0.05Hz single pole filter, both overall and a close up of the overshoot
Any questions or comments, please feel free to contact peter.selvey@medteq.jp